Power for All partner SEforAll recently launched an updated interactive addition to their website, called "heat maps". Relying on data from their knowledge partners, the maps graphically highlight countries and regions that are making the most progress, as well as those that are facing the biggest challenges, on major sustainable energy issues.
The "heat maps" target four key areas of sustainable development: clean cooking, electricity access, energy efficiency and renewable energy—which all focus specifically on access.
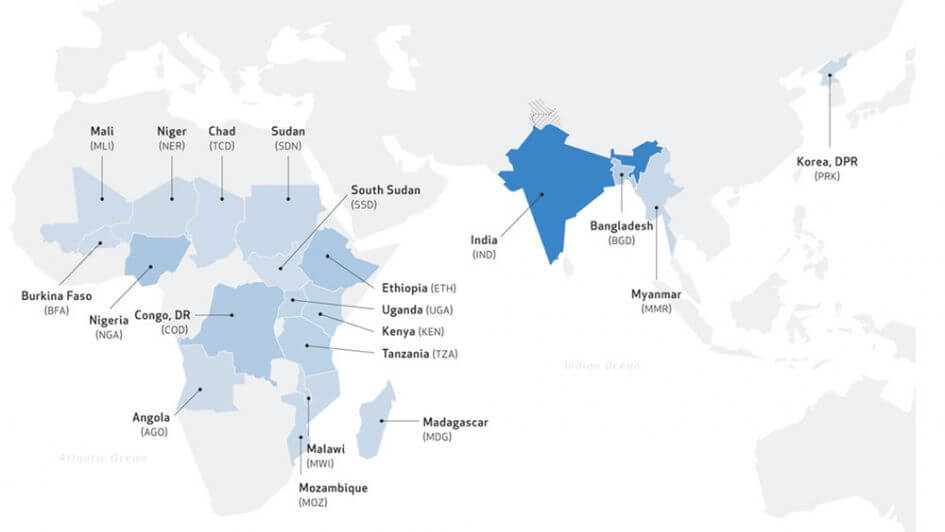
All of these "heat maps" identify 20 "high impact" countries facing sustainable energy challenges across the four access categories. "In the case of electricity access and clean cooking, for example, the high-impact countries are all in Sub-Saharan Africa and Asia." SEforAll has posted fact sheets for each key indicator on their website, illuminating key trends and countries making the biggest leaps.
“By combining and analyzing data in these heat maps, we can show global leaders where they can make the biggest and fastest inroads towards our goal of universal energy access for all by 2030,” said Jane Olga Ebinger, Director of Policy at SEforALL, “The maps also show where big gains are happening so that we can replicate the success of others and help leaders in government, business and civil society make smart choices.”
Ebinger will be posting blogs on the heat maps in the next few weeks, and SEforAll will be posting guest blogs from their partners— as well as promoting the "heat maps" on social media via their hashtag #SDG7HeatMaps.
Most of the data used to create these maps comes from 2017 Global Tracking Framework, which SEforAll has used to assesses progress toward sustainable energy goals since 2013. "The Framework uses available data from household surveys and international databases to track access to electricity, clean cooking sources, improvements in energy intensity and increases in the share of renewable energy compared to overall energy consumption."
"The maps also draw on data from the Regulatory Indicators for Sustainable Energy–commonly known as RISE–which evaluate 111 countries on the quality of their policies and regulations for energy access, renewable energy and energy efficiency."
For further details on the heat maps or any interview requests, please contact:
Beth Woodthorpe-Evans at Sustainable Energy for All | +1 202 390 1042